IBM Watson Client Experience Centers
Located in San Francisco, New York and Cambridge, the IBM Watson Client Experience Centers are destinations for clients to learn and experience the power of Watson in a hands-on environment.

Revealing the power of Watson’s AI abilities
We developed a number of bespoke, narrative-driven, and highly interactive media and physical projects over a long term collaborative partnership. Every touch point is designed and tailored to the domain knowledge and business problems facing their clients today.
…
My Role: Associate Creative Director, Art Director
Collaborators: Albane Jerphanione, Andrea Worby, Angelica Jang, Anthony Roy, Avi Grayson, Charlotte Harris, Chris Fung, Chris Schnaars, Christian Browne, Crystal Law, Danny Well, Dasul Kim, Eric Mika, Francie Grogan, Guillaume Marais, Jeanne Angel, Karen Vanderbilt, Kim Gim, McKenna Cole, Marijanna Wotton, Myles Bryan, Nicole Messier, Nima Vakili, Nina Bosch, Oriol Ferrer Mesià, Oscar Ma, Pearlyn Li, Rona Binay, Ryan Schoenherr, Siavash Khasha, Sundar Raman, Terrell McIver, Vidya Santosh; IBM Team: Jenny Woo, Rob Harrigan; Oblong Industries: Justin Shrake, Michael Schuresko, John Carpenter, Pete Hawkes, Samson Klitsner, Brandon Harvey
Projects


Immersion Room // Speculative Stories
Watson in the Wild // Case Studies


Watcon Mobile Immersion Room
Design Talks & events
IBM Watson Tangibles
Watson Local Pulse
Immersion Room: Speculative Stories
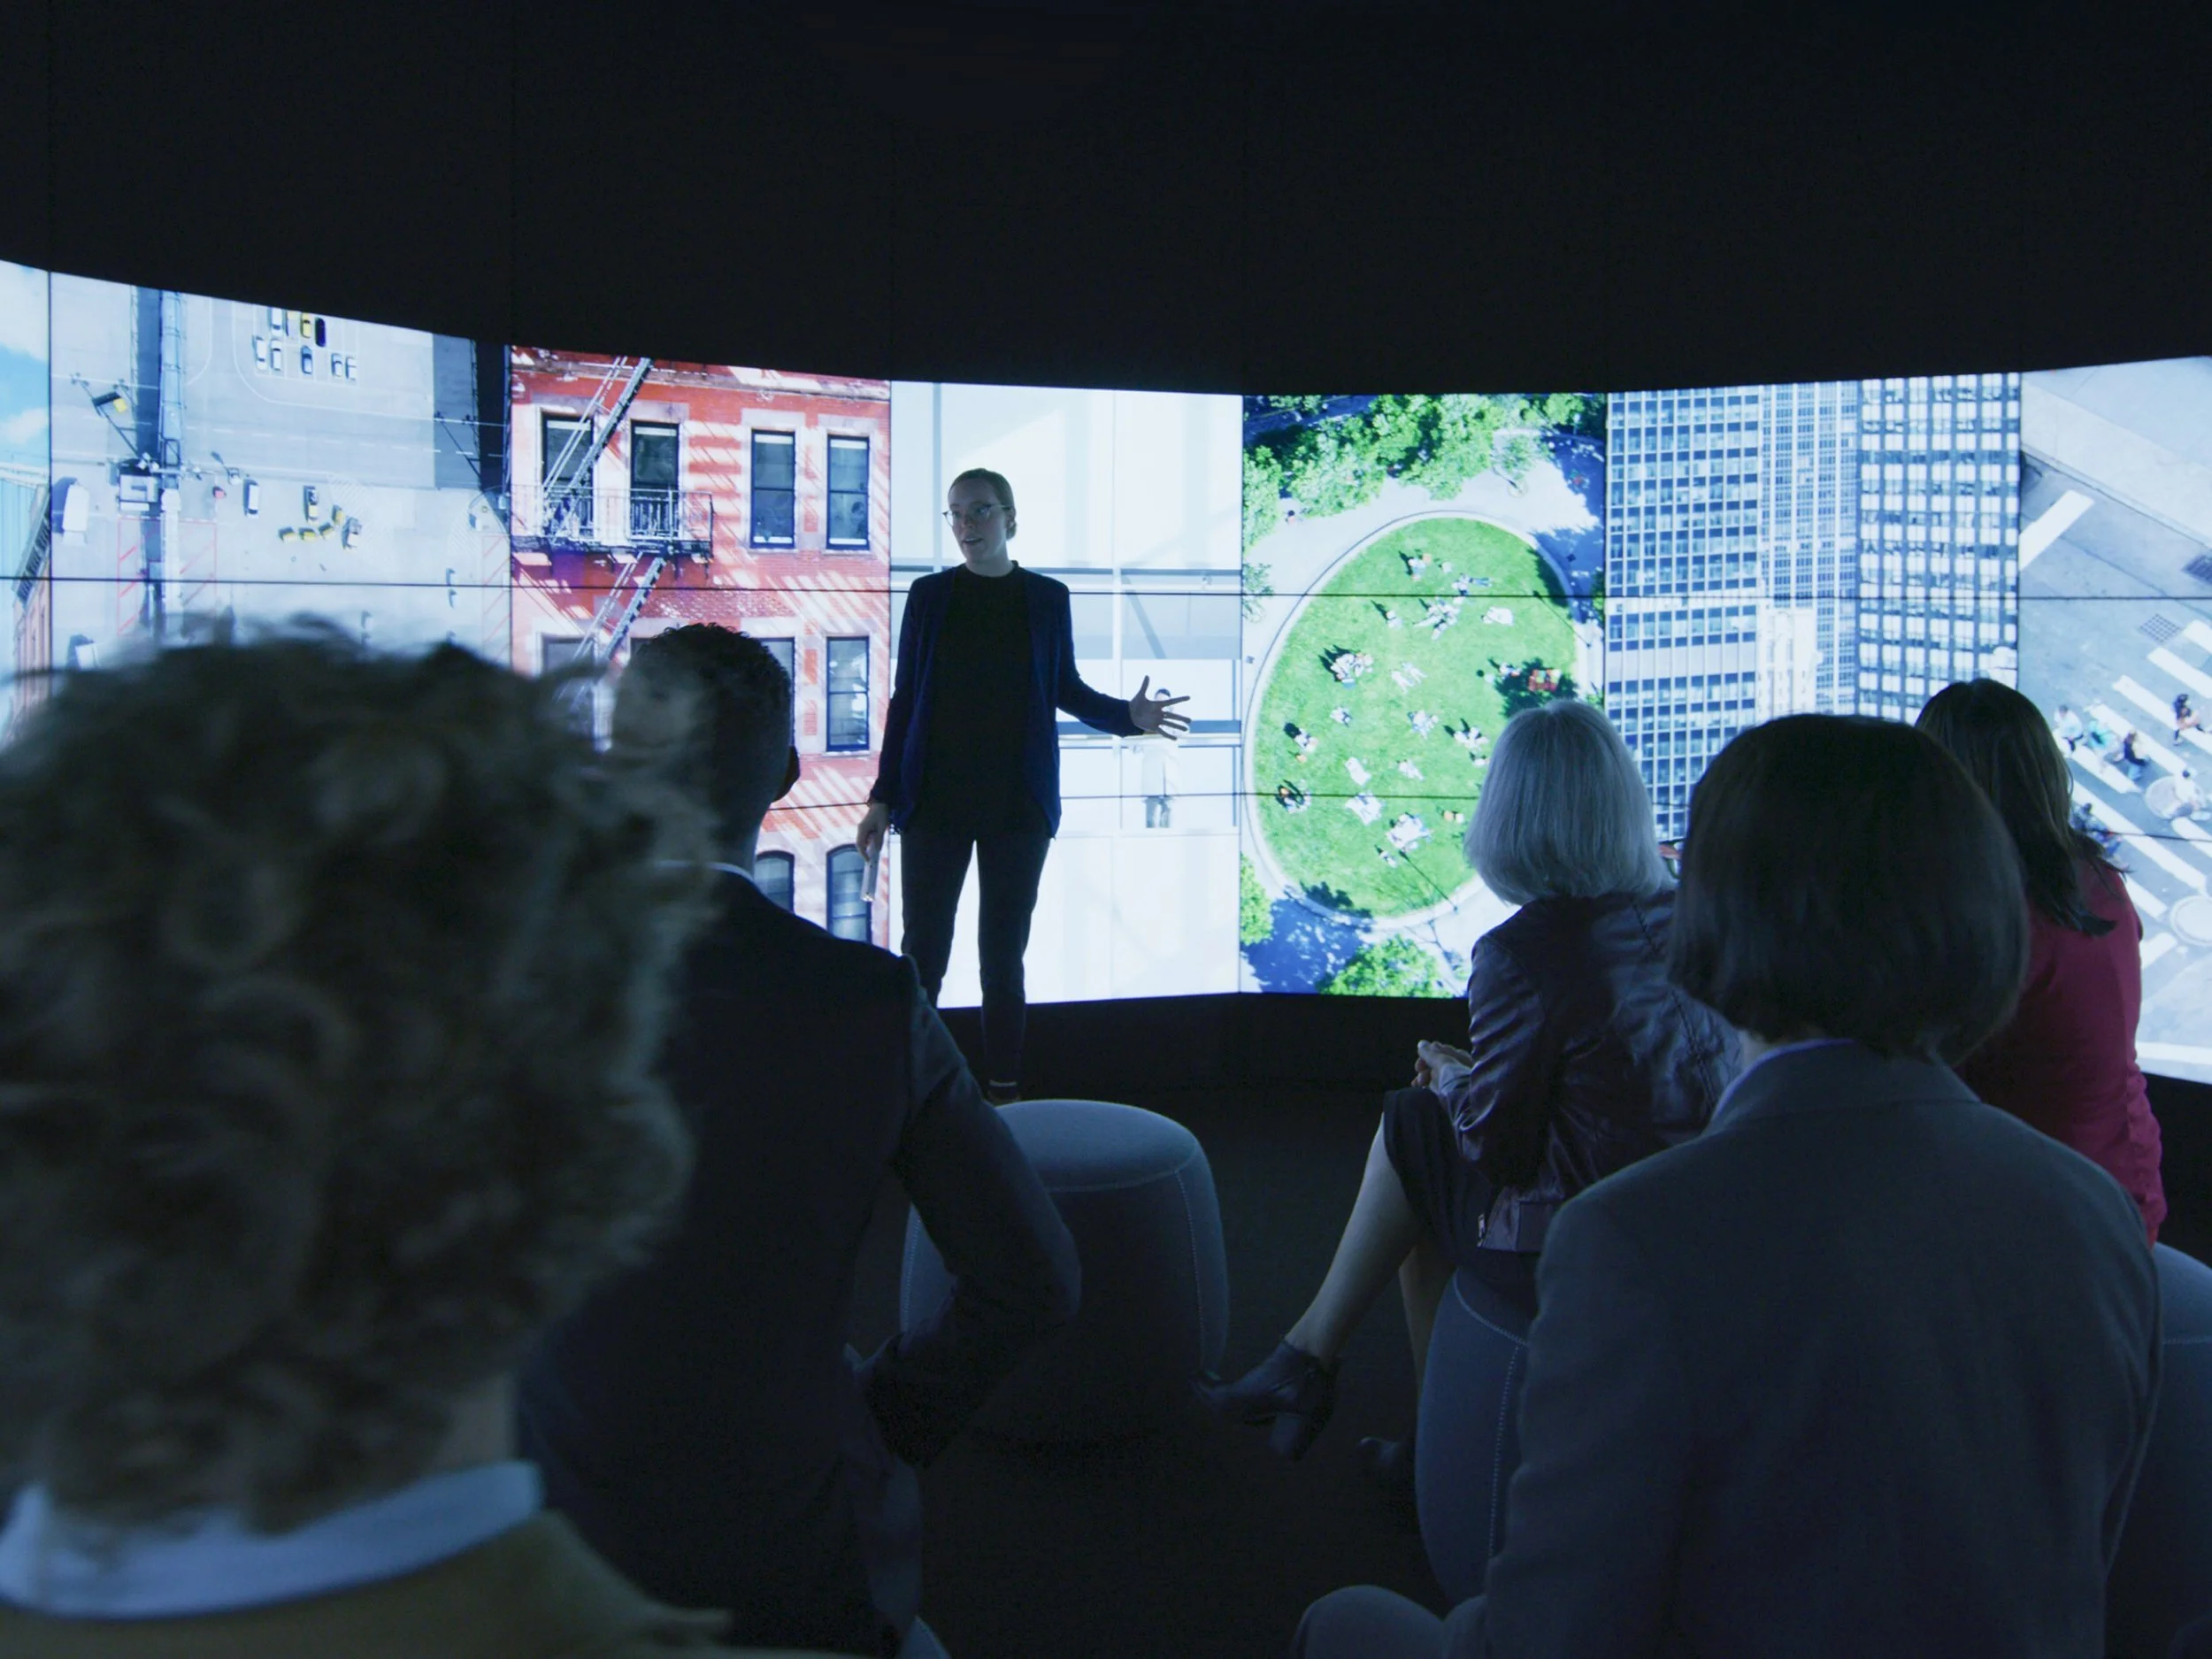
The centerpiece of the Watson Client Experience Center is the Immersion Room — a 270° interactive storytelling theater, powered by Oblong Industries dynamic spatial computing system, and allowing guests to explore and experience data stories in a hands-on and immersive way.
Visitors are guided through a ~10 minute experience by a WCEC host where they participate in decision making to resolve a series of problems, demonstrating the powerful capabilities of Watson along the way. Through a mix of linear, spatial and interactive media, the stories are real-time and highly stable for a sales environment, while also being truly data- driven, spatialized and compellingly interactive storytelling.


Process
Working closely with IBM’s Creative Directors, Engineers, and Client Experience Center Hosts, we co-designed a variety of different stories, based on expertly plausible speculative scenarios. By working on location with IBM’s Creative Directors and Engineers, we were able to take a truly iterative and agile design approach through access to the real hardware, software and contexts of use.

Every project starts with a week-long sprint with IBM Watson's Creative Directors to workshop the initial idea and to plan for the visual design and coding collaborations to follow.

Narrative-driven design structures the workshops, with a fully fleshed out story being a primary deliverable at the end of creative ideation workshop week.

The visual designers and creative directors design and detail the narrative arc — sometimes including characters, datasets or real case studies to inspire and guide.

Coders, visual designers, marketing execs and subject matter experts are brought together to vet the feasibility, accuracy and efficacy of the story and creative direction.

Proof of concept reviews of sequential stills and animations are reviewed at-scale to refine the overall narrative and visual treatments.

Later phase workshops focus on detailing visual treatments and animation in the true development environment and testing it against the unique spatial interaction model.

The final step before launch is proofing and tweaking the script via run-through's with the client experience center Hosts.
Speculative Stories

Disaster Management
Surveillance and deployment of crisis mitigation utilities in a metropolitan city after a major natural disaster

Foundations of AI
A deep dive into the fundamental building blocks of artificial intelligence and how models are built and deployed

Supply Chain
Uncovering potential international supply chain breakdowns through the parsing of numerous news-based datasets

Data Governance
Using sentiment analysis paired with privacy regulation to support the health and happiness of employees at a company

Financial Services
Uncovering suspicious activity in banking services to prevent fines from banking fraud regulations

Cloud Pak
Exploring how to build a data fabric connecting siloed data distributed across a hybrid cloud landscape, while managing data governance, quality and applicability
watson Tangibles

AI can be difficult to understand, and even harder to imagine the potential for applications in a given business. This experimental project looked to give visitors to the Watson Client Experience Centers a tangible, hands-on and literal way of understanding, applying, and innovating on using Watson’s AI capabilities.
Using different open datasets like the MET’s artwork collection, weather data, The Cooper Hewitt’s design collection, Census data, and open data from data.gov, users can mix and filter data to reveal interesting patterns and concepts. The relatively small interfaces on the devices were designed to show data visibly flowing through pipes, and allow physical controls to realistically effected the flow. Integration with the Watson CEC interactive wall let visitors broadcast and share their findings with their group. Our team on this project included a number of people who worked on various parts of the process — such as paper prototype staging with real users, simulated interactive systems, physical prototypes, interface design and physical space integration. My focus was on the interface design, play ergonomics and physical design experience with the Client Experience Centers.


watson in the wild

We created a series of customizable, animated case studies that tell visual stories of how different IBM clients use Watson successfully in their businesses. Featured in every Watson Client Experience Center is a 40ft, multi-touch media wall used for different interactive, multimedia experiences — the Watson in the Wild Case studies being the primary interactive media.
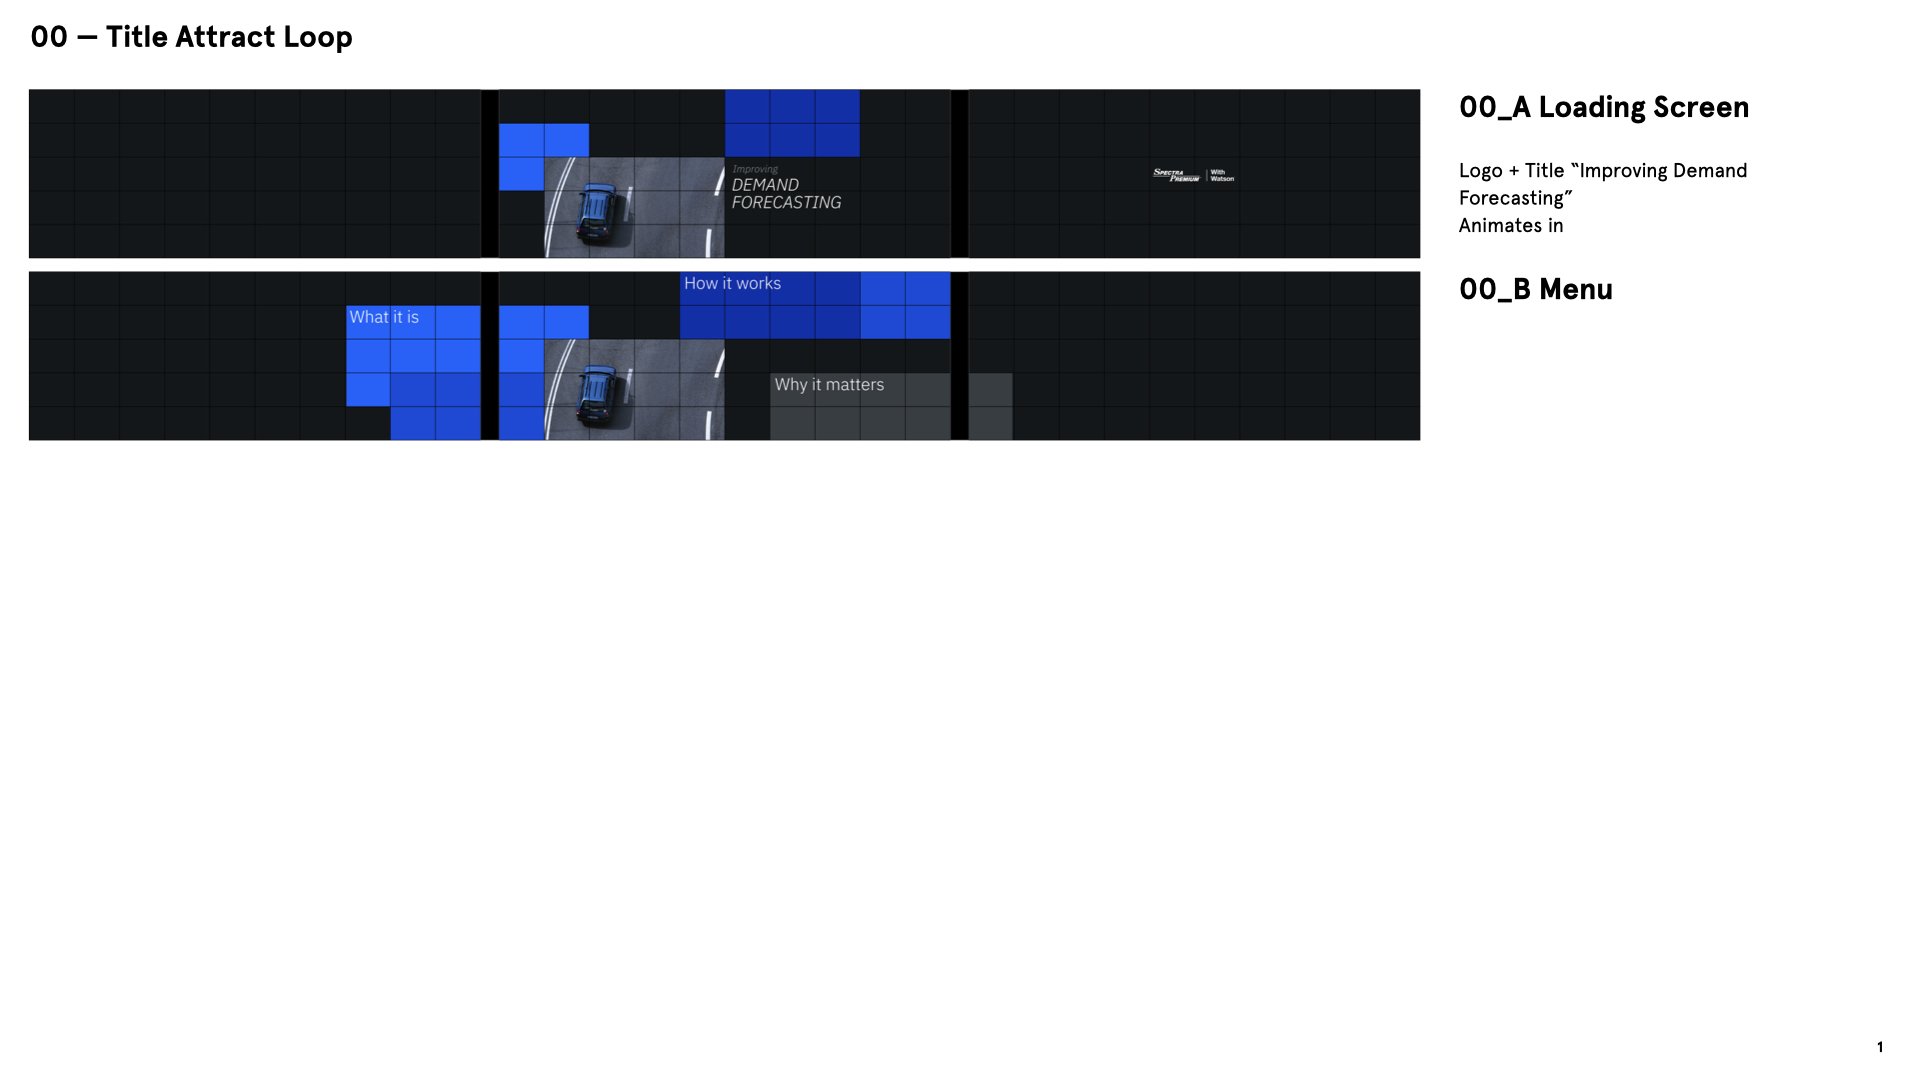
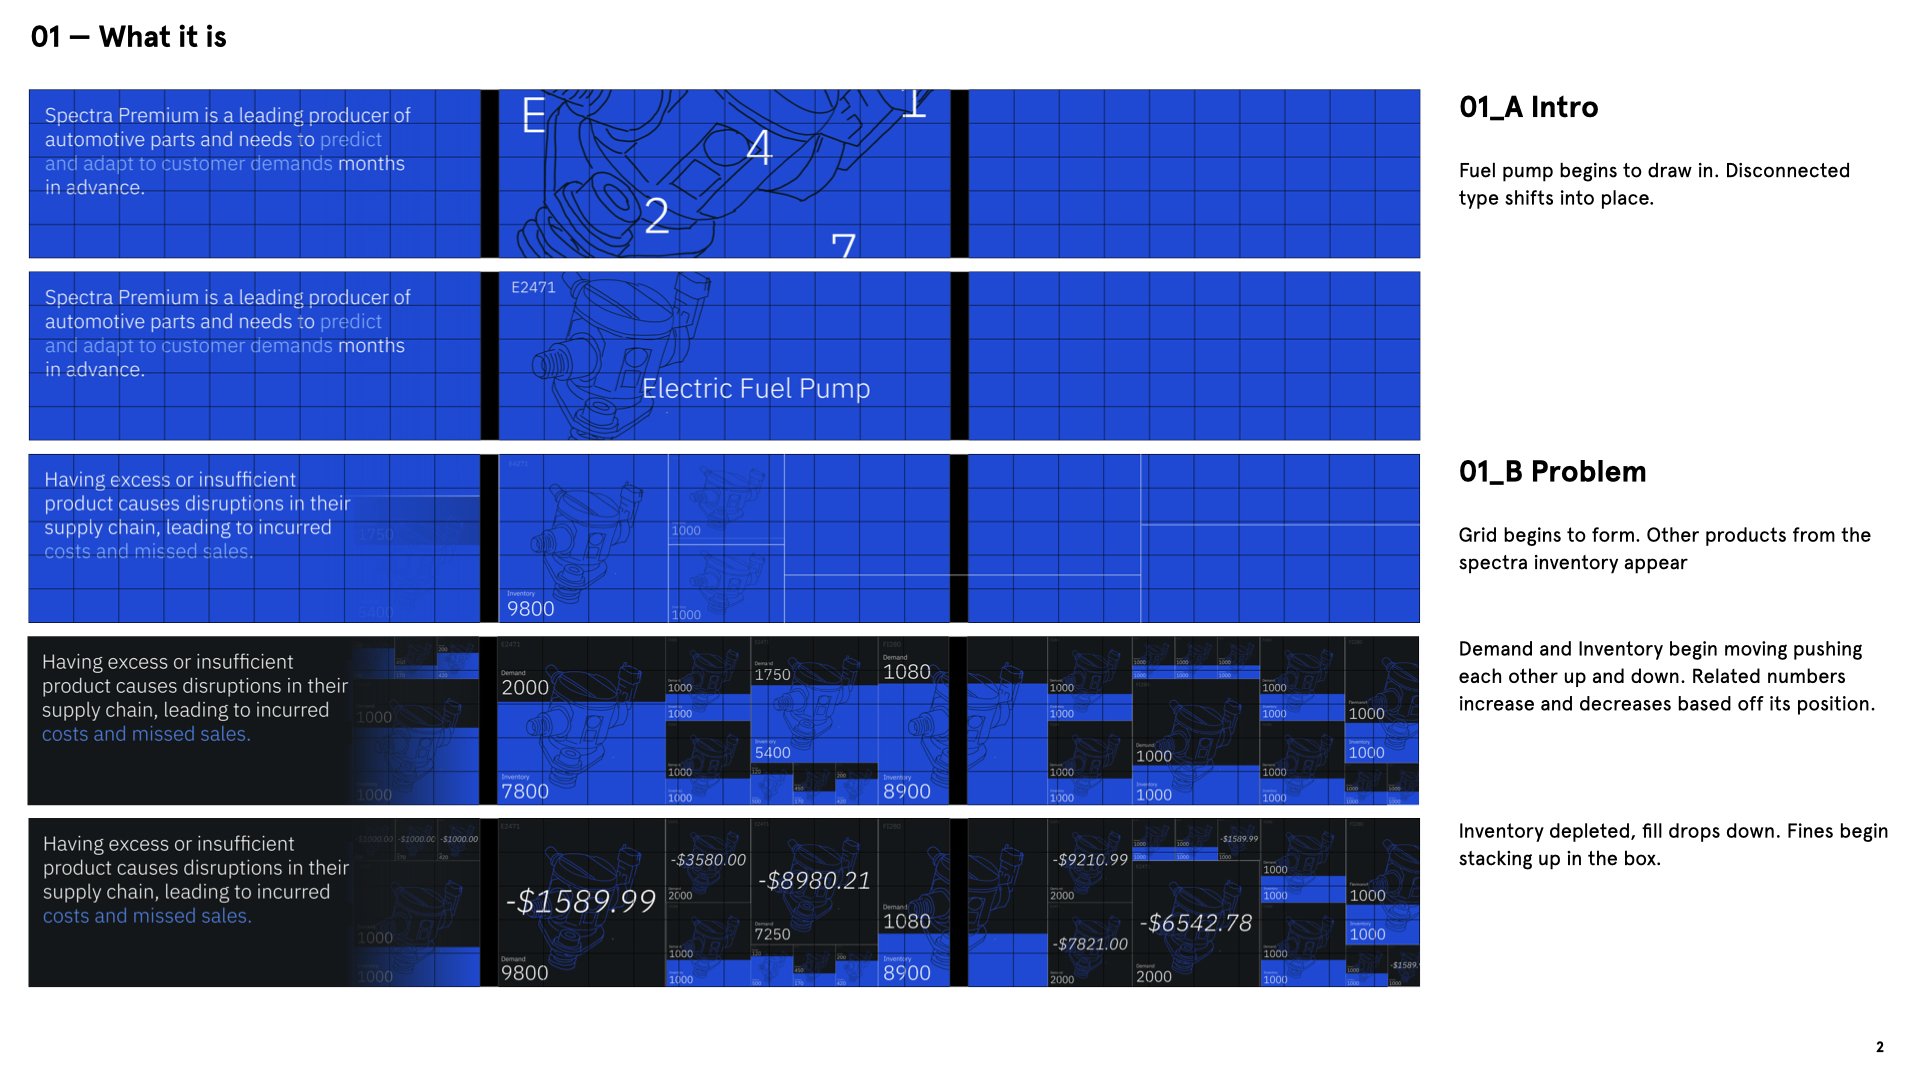
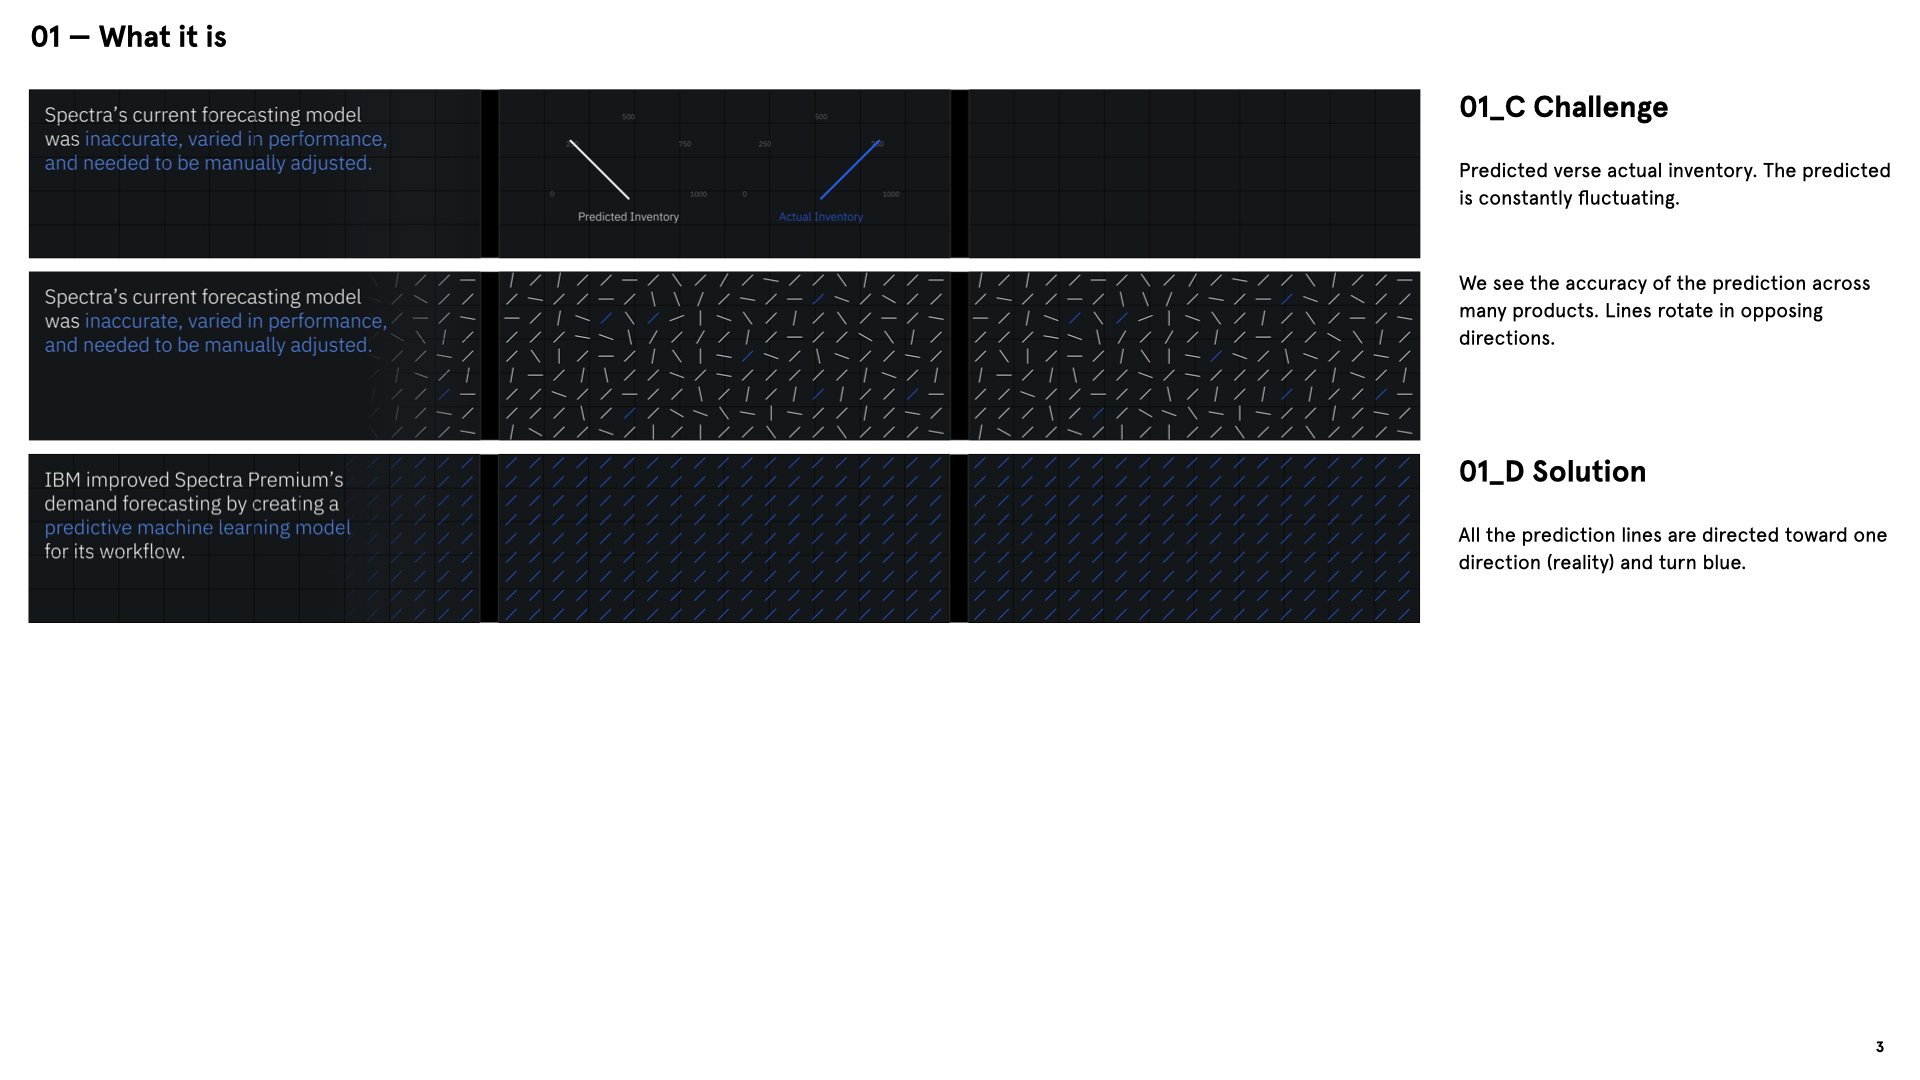
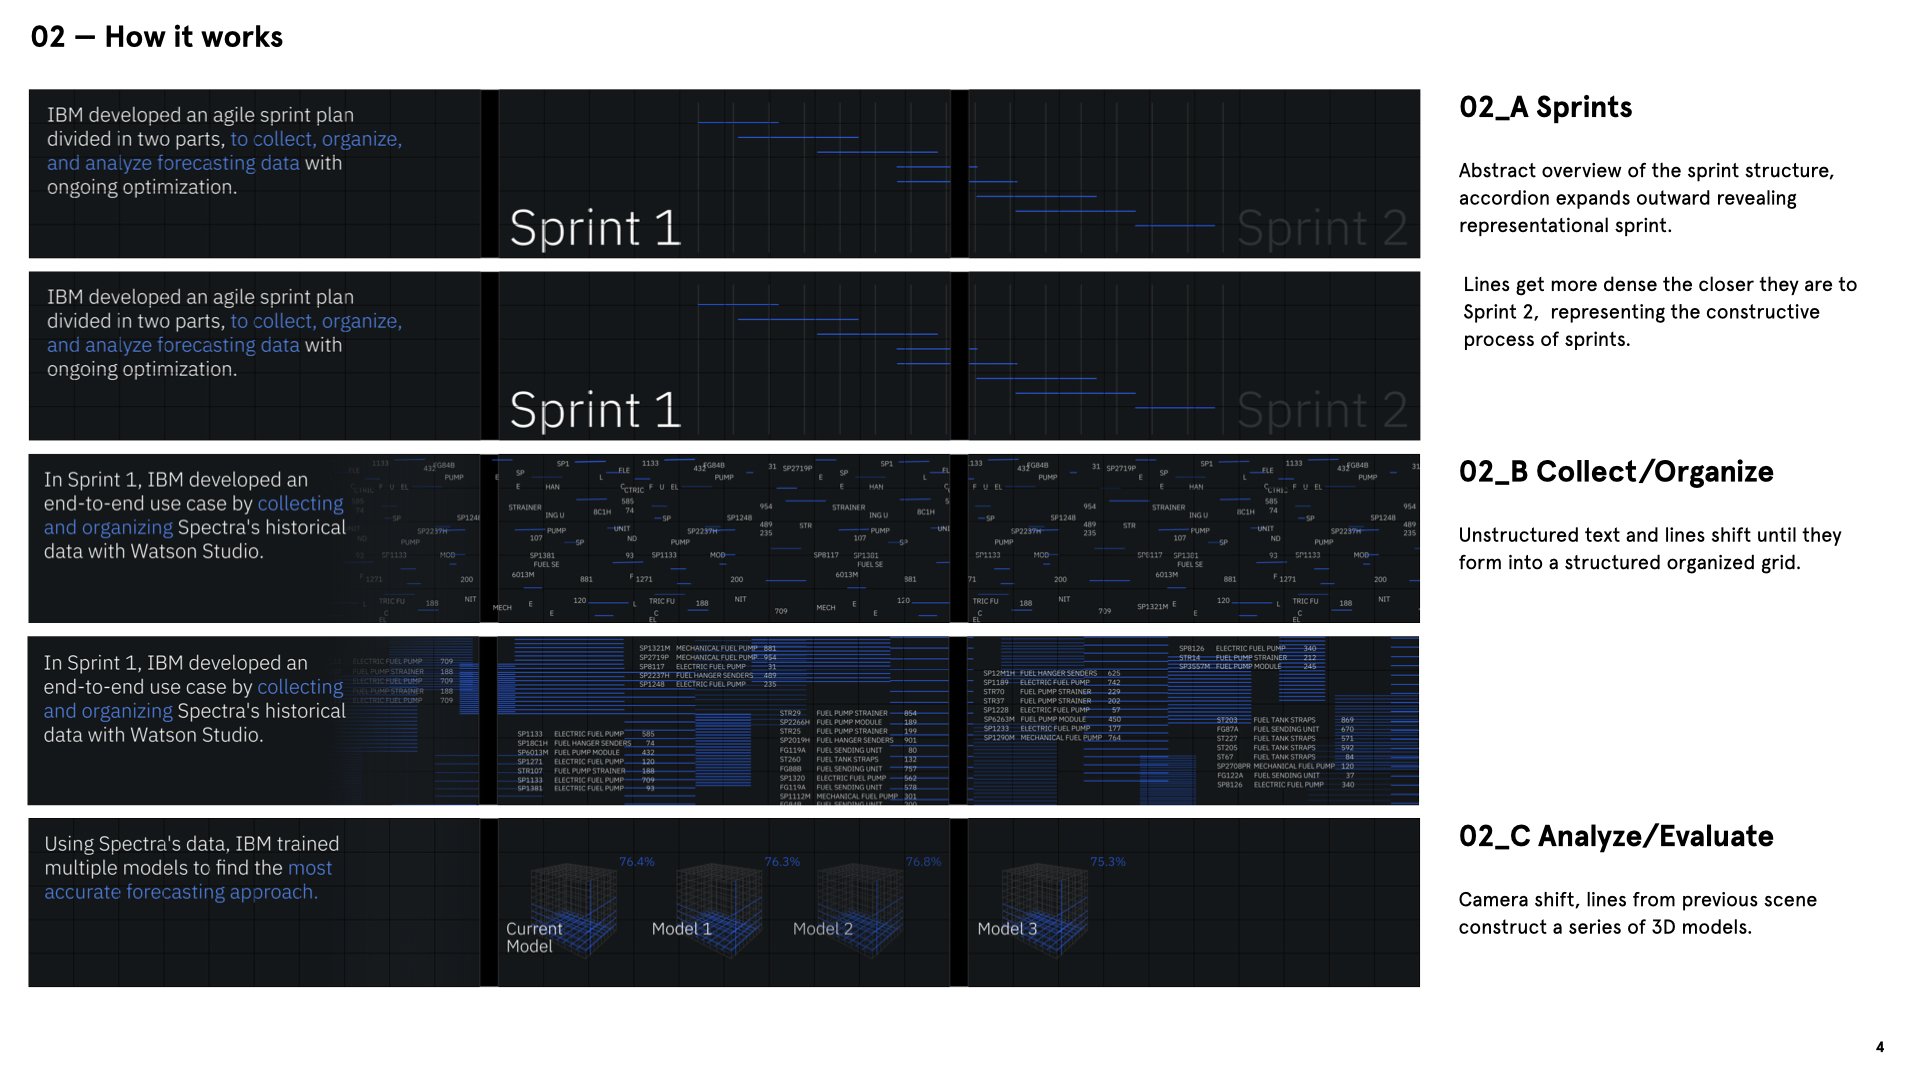
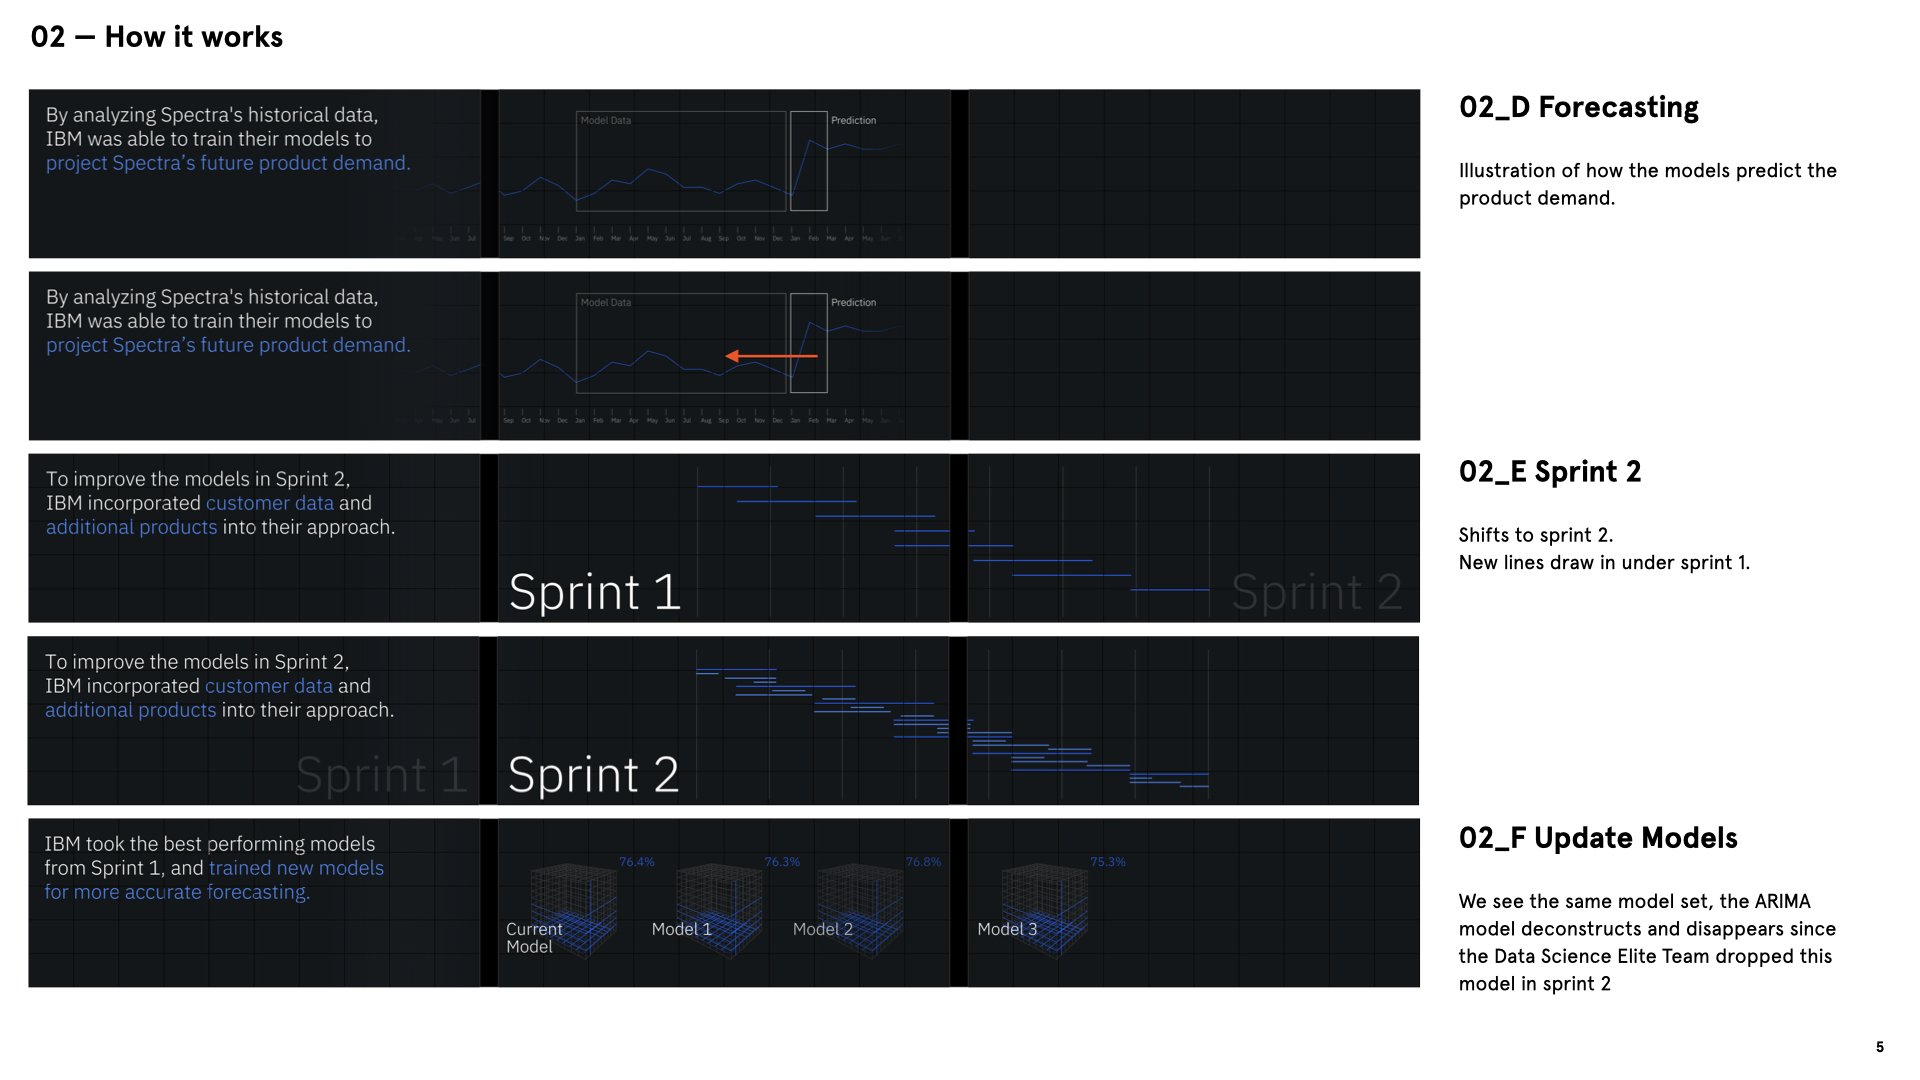
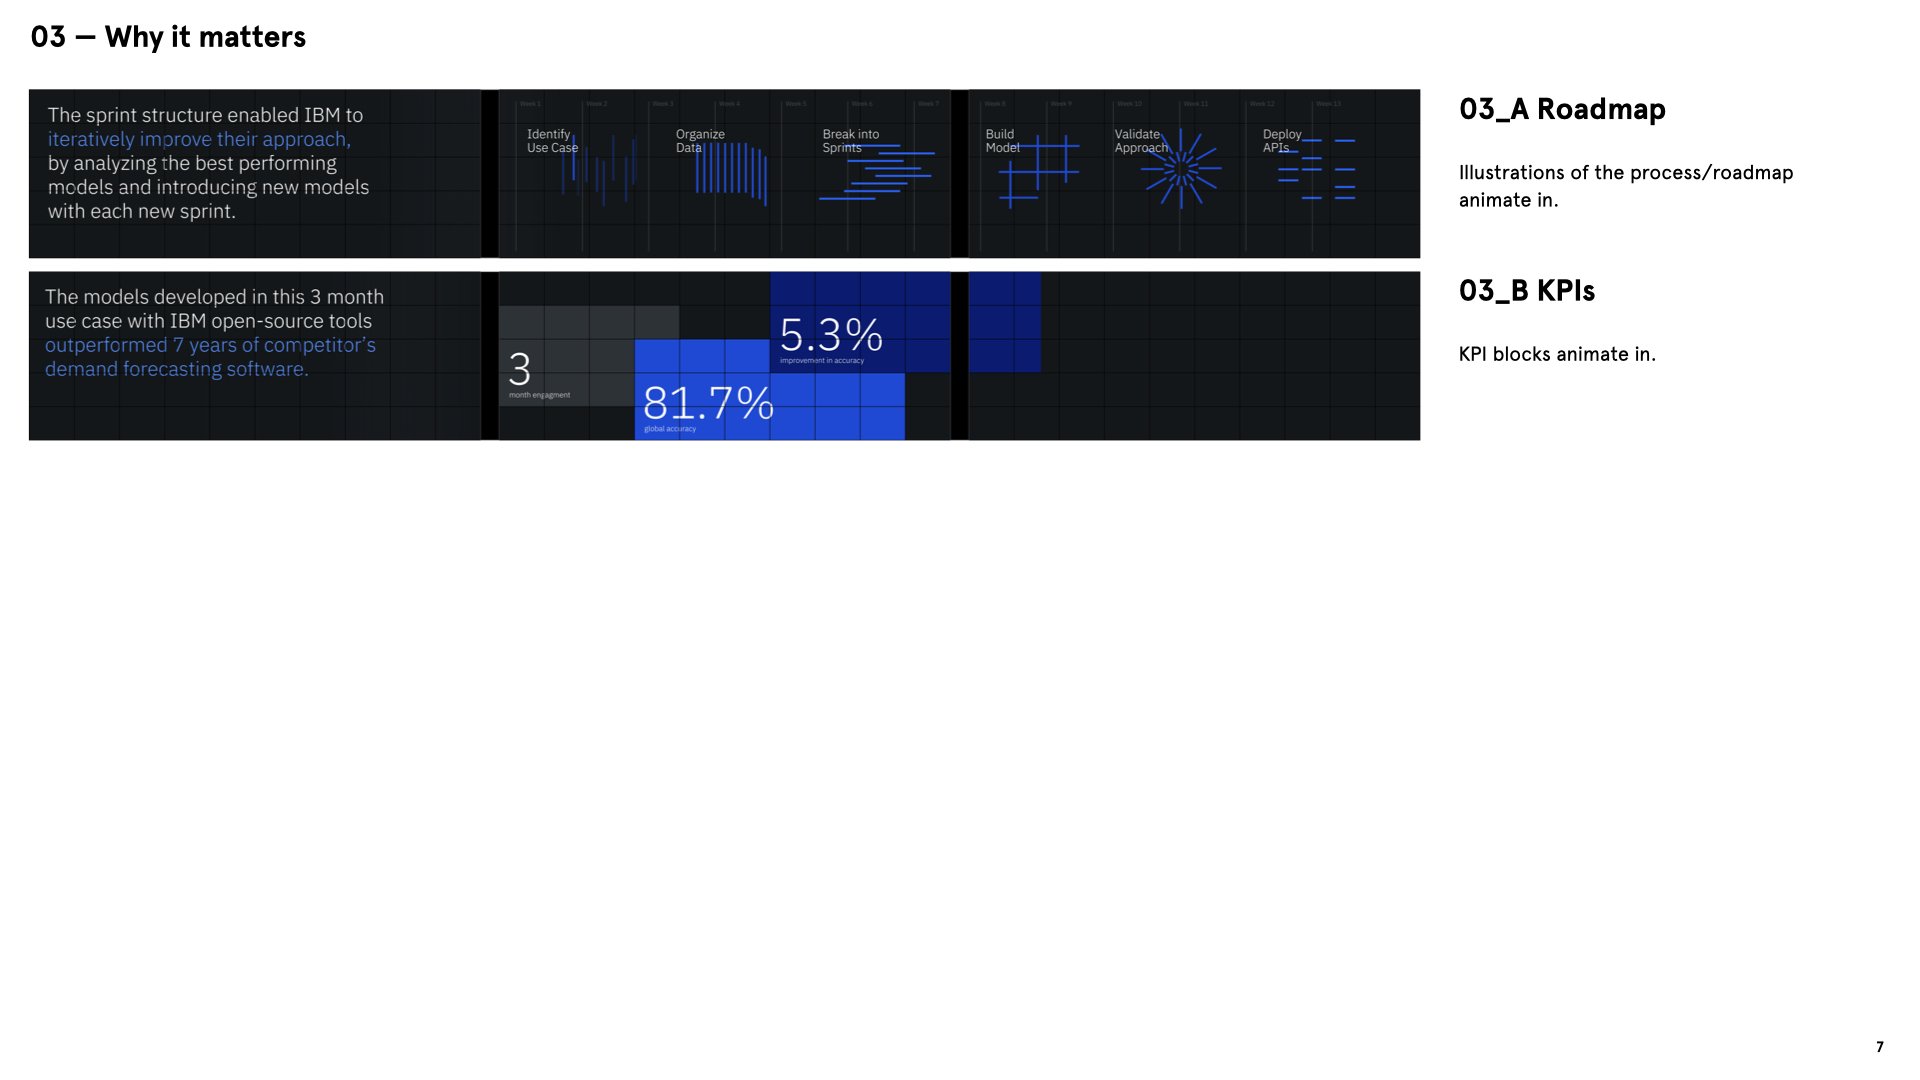
Using real data and concept-driven graphic animations in the iconic IBM design language, we brought a number of case studies to life to inspire clients. Because the applications of AI are constantly evolving, and IBM desired to inspire innovative uses and give their new clients an edge in their markets, we developed a flexible, templated system for creating the stories as fast and creatively as possible. Each story is based on a structure of ‘what it is, how it works, why it matters’ which gave us a framework to quickly storyboard and iterate on visual metaphors and concepts to convey very complex ideas clearly and in beautiful and inspiring ways. Using a web-based delivery system, we design the applications, we allowed Watson CEC Hosts to control, edit and reorganize our beautiful animated storytelling materials through a very simple web tool, to help them meet the needs and expectations of the B2B clients they were hosting.
Motion Design on the Watson in the Wild Projects was done by Myles Bryan, Angelica Jang and Crystal Law.
Case Studies
Every interactive story is comprised of a sequence of motion graphics — all stitched together on the backend by IBM’s developers in the G-Speak spatial operating environment created by Oblong Industries. The following are examples of visual stories we made for different case studies.

Pinacoteca
How a Brazilian Art Museum uses Watson Natural Language Processing to answer visitors questions about art

Woodside
How an oil and gas company uses Watson to help their engineers diagnose mechanical issues by accessing its vast archive of engineering documentation

HR Block
How a major accounting company uses Watson to evaluate their clients tax information to offer them the best yearly return

How an automotive insurance companies uses Watson visual recognition to quickly assess damages and create repair quotes
Bradesco

Belron
How a major Brazilian banking company uses Watson as a virtual assistant to understand its multi-language customer base and serve them better

Ned Bank
How a bank uses Watson to monitor and predict failures and maintenance of its thousands of ATMs

Spectra
How an automotive products company uses AI to predict disruptions in their supply chain

Credit Mutuel
How a bank uses Watson to advise clients about products that match their needs

Airbus
How an aerospace company used Watson to create the CIMON assistant, a scientific partner and empathetic ally
storyboards

motion studies
watson Local Pulse

We created this interactive app to act as a welcoming experience and light-touch, playful demonstration of Watson’s AI capabilities for traveling visitors coming to the Watson Client Experience Centers. Using local datasets, each client center was able to generate a real-time ‘portrait’ of the city where the Client Experience Center was located, showing the personality and highlights of the city and also making recommendations for visitors after the leave the CEC.
A number of different modes let visitors explore and combine datasets in different and interesting ways, while also providing a behind the scenes view of how Watson was generating those insights, relationships and recommendations. Connections between social media, weather, food, music, art and others created a rich portrait of the local environment and a welcoming introduction to both Watson and the local city.
User Experience Sequence
The attract screen reveals animations of data visualization using Watson on open source data
1.
The experience starts by exploring localized data from each of the Watson Client Experience Locations
2.
An accordion style interface lets visitors explore different Watson AI tools applied to local datasets
3.
Tone analysis is used on local Spotify data to see what mood San Francisco is in based on listening patterns
4.
Using visual recognition to see patterns of what people in San Francisco are eating for lunch
5.
Using visual recognition on the MET collection to show art with the same weather as the current city’s weather
6.
Drilling down into any of these AI applications showcases in detail how the AI model and application works
7.
watcon mobile immersion room

IBM was interested in creating a traveling immersion room that could work in brighter settings like at pop ups and tradeshows. We worked with them to create a series of light-touch, flexible designs that could be easily and quickly assembled and disassembled, with robust, guest-driven interactive kiosks using .
Our design used the iconic Watson logo and exploded it to create an intimate space away from the typical noise and visual cacophony of tradeshows. An internally projected touch-screen table is positioned at the center, and allows guests to get a hands-on demonstration of Watson’s AI capabilities on real datasets — all built from components of the Client Experience Center Immersion Room materials. Additionally, Watson in the Wild case studies can be found and explored on the larger, portrait-oriented plinths scattered around and inside the exhibit.


